Latest figures from ONS have revealed the UK’s average house price has increased from £270,000 to £275,000 in December 2021. In fact, house prices across the UK have seen such a huge increase over the past decade, it’s harder than ever to get on the property ladder.
But what exactly does £275,000 get you across the UK?
ConservatoryLand’s latest study delves into what the UK’s average house price buys you, analysing square meterage, type of house, number of bedrooms and bathrooms, and the likelihood of securing a driveway across the 30 most populated cities.
Check out the findings below!
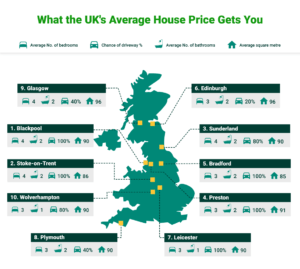
According to the study, Blackpool offers the best value for money, with the average property being detached and giving you 2 bathrooms, 4 bedrooms and a driveway, while perhaps unsurprisingly London offers the worst with £275,000 getting homebuyers only a flat, with 2 bedrooms, 1 bathroom and no driveway.
If the number of bedrooms is the most important factor in choosing where to live, Kingston upon Hull offers the highest number for the UK’s average house price. You can expect to have, on average, four bedrooms in your home, alongside Blackpool. Sunderland and Stoke-on-Trent rank second in the study, with 3.8 bedrooms on average.
Despite offering nearly the same number of bedrooms on average, Blackpool’s average sold price in the last 12 month is far cheaper than Kingston upon Hull, with house prices going for £15,000 less, giving you the best of both worlds in terms of value for money and size.
When it comes to square meterage, Cardiff offers the most space averaging £2,750 per square metre, while London is named the most expensive with homebuyers paying an eye-watering £5,851 per square metre.
The UK cities offering the best value for money:
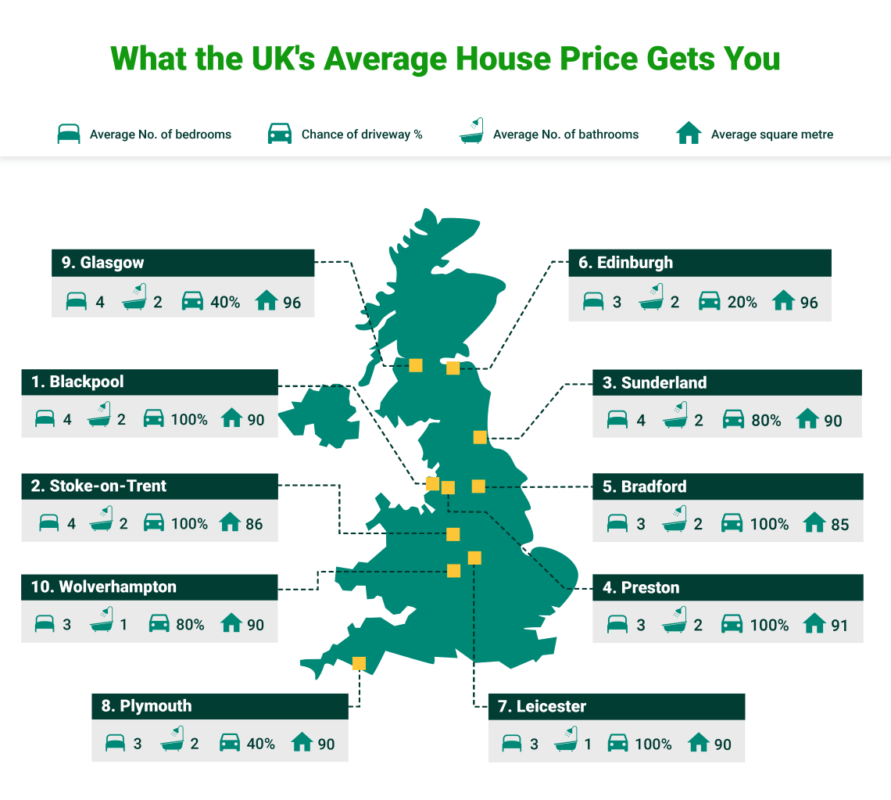
| Rank | City | Average No. of bedrooms | Average No. of bathrooms | Chance of driveway (%) | Average square metre |
| 1 | Blackpool | 4 | 2 | 100 | 90 |
| 2 | Stoke-on-Trent | 4 | 2 | 100 | 86 |
| 3 | Sunderland | 4 | 2 | 80 | 90 |
| 4 | Preston | 3 | 2 | 100 | 91 |
| 5 | Bradford | 3 | 2 | 100 | 85 |
| 6 | Edinburgh | 3 | 2 | 20 | 96 |
| 7 | Leicester | 3 | 1 | 100 | 90 |
| 8 | Plymouth | 3 | 2 | 40 | 90 |
| 9 | Glasgow | 4 | 2 | 40 | 96 |
| 10 | Wolverhampton | 3 | 1 | 80 | 90 |
What the average house price buys you in the 30 most populated cities across the UK
| Rank | City | Average number of bedrooms | Average number of bathrooms | Average square meterage | Cost per square metre (£) | Chance of driveway (%) | Type of house |
| 1 | Blackpool | 4 | 3 | 90 | 3,056 | 100 | Detached |
| 2 | Stoke-on-Trent | 4 | 2 | 86 | 3,198 | 100 | Detached |
| 3 | Sunderland | 4 | 2 | 90 | 3,056 | 80 | Detached |
| 4 | Preston | 3 | 2 | 91 | 3,022 | 100 | Detached |
| 5 | Bradford | 3 | 2 | 85 | 3,235 | 100 | Semi-detached |
| 6 | Edinburgh | 3 | 2 | 96 | 2,865 | 20 | Semi-detached |
| 7 | Leicester | 3 | 1 | 90 | 3,056 | 40 | Semi-detached |
| 8 | Plymouth | 3 | 2 | 90 | 3,056 | 40 | Semi-detached |
| 9 | Glasgow | 4 | 2 | 96 | 2,865 | 40 | Semi-detached |
| 10 | Wolverhampton | 3 | 1 | 90 | 3,056 | 80 | Detached |
| 11 | Kingston upon Hull | 4 | 2 | 87 | 3,161 | 80 | Detached |
| 12 | Coventry | 3 | 2 | 89 | 3,090 | 40 | Semi-detached |
| 13 | Birmingham | 4 | 2 | 90 | 3,056 | 40 | Semi-detached |
| 14 | Sheffield | 3 | 1 | 88 | 3,125 | 60 | Semi-detached |
| 15 | Liverpool | 3 | 2 | 92 | 2,989 | 60 | Detached |
| 16 | Newport (Wales) | 3 | 1 | 95 | 2,895 | 60 | Semi-detached |
| 17 | Northampton | 3 | 1 | 91 | 3,022 | 60 | Semi-detached |
| 18 | Derby | 3 | 1 | 91 | 3,022 | 60 | Semi-detached |
| 19 | Nottingham | 3 | 1 | 85 | 3,235 | 60 | Detached |
| 20 | Norwich | 3 | 1 | 83 | 3,313 | 80 | Semi-detached |
| 21 | Cardiff | 3 | 2 | 100 | 2,750 | 0 | Semi-detached |
| 22 | Luton | 2 | 2 | 89 | 3,090 | 40 | Terraced |
| 23 | Southampton | 2 | 2 | 84 | 3,274 | 20 | Flat |
| 24 | Milton Keynes | 2 | 1 | 91 | 3,022 | 40 | Flat |
| 25 | Leeds | 2 | 1 | 86 | 3,198 | 20 | Flat |
| 26 | Bristol | 2 | 1 | 92 | 2,989 | 20 | Terraced |
| 27 | Southend-on-Sea | 2 | 1 | 94 | 2,926 | 0 | Flat |
| 28 | Manchester | 2 | 1 | 86 | 3,198 | 0 | Flat |
| 29 | Reading | 2 | 1 | 88 | 3,125 | 0 | Flat |
| 30 | London | 2 | 1 | 47 | 5,851 | 0 | Flat |
Methodology & sources
We took the UK’s average house price to find what you can expect to get for your money across UK cities. Taking the first five listed properties on Zoopla, and removing duplicates, we found the average number of bedrooms, bathrooms, driveways and also the breakdown of different property types, to find what you can get for the average UK house price.
Our seedlist was produced from the most populated UK cities. Where data was not available for house listings, we moved to the next most populated city.
In order to find the average house prices per city, we took the average sold price from the last 12 months from Zoopla.
- https://www.gov.uk/government/news/uk-house-price-index-for-december-2021
- https://worldpopulationreview.com/countries/cities/united-kingdom
- https://www.rightmove.co.uk
- https://www.zoopla.co.uk/house-prices/
- https://www.ons.gov.uk/peoplepopulationandcommunity/housing/methodologies/adminbasedstatisticsforpropertyfloorspacefeasibilityresearchenglandandwales#geographical-analysis-of-median-floor-space
- https://www.ons.gov.uk/peoplepopulationandcommunity/housing/articles/housepriceshowmuchdoesonesquaremetrecostinyourarea/2017-10-11
